Wednesday, October 2, 2024

CASE STUDY : ADANI PORTS OPTION CHAIN USING LTP CALCULATOR METHOD ON 01.10.2024


ON 01.10.2024   GOOD BREAKOUT AFTER CONSOLIDATION SEEN IN ADANIPORTS 

HERE ARE SOME IMPORTANT POINTS ABOUT THE BREAKOUT


1. BEFORE BREAKOUT : SPOT PRICE IS AT 1455  
2.USE ONE MINUTE CHART FOR VOLUME SPIKES 


3.ABOVE THE TREND LINE GREEN TREND ESTABLISHMENT CANDLES CAN BE  SEEN
4.IF YOU SEE FEW MINUTES BEFORE THE BREAKOUT AT VOLUME PANEL  YOU CAN OBSERVE HEAVY VOLUME SPIKES PRESENCE
5.

Sunday, September 22, 2024

Dow Theory


Dow Theory is a financial theory that provides a framework for understanding market trends. It was developed by Charles Dow, co-founder of the Dow Jones & Company, and is fundamental to technical analysis. Here's a brief explanation of its key components:


1. Market Trends

Primary Trend: Long-term trend lasting from several months to several years. This trend can be an uptrend (bull market) or a downtrend (bear market).

Secondary Trend: Intermediate trend that lasts from a few weeks to a few months. It often acts as a correction or consolidation within the primary trend.

Minor Trend: Short-term trend lasting from a few days to a few weeks. These are daily fluctuations in the market.


2. Market Phases

Accumulation Phase: When informed investors start buying, but the general market is still pessimistic.

Public Participation Phase: When the broader market recognizes the trend, leading to widespread buying or selling.

Distribution Phase: When smart investors begin to sell, and the public starts to enter the market, often at the peak.


3. The Averages Must Confirm Each Other

Dow Theory states that for a trend to be considered valid, both the Dow Jones Industrial Average (DJIA) and the Dow Jones Transportation Average (DJTA) must confirm it. For example, if industrials are reaching new highs, transportation stocks should also be reaching new highs to confirm the uptrend.


4. Volume Confirms the Trend

Volume should increase in the direction of the trend. For example, during an uptrend, volume should increase when prices rise and decrease when prices fall.


5. Trends Persist Until a Reversal Occurs

A trend is assumed to remain in place until a definitive signal indicates a reversal. This principle suggests that trends are persistent and will not change direction without substantial evidence.


Dow Theory helps traders and investors understand the broader market trends and make informed decisions based on the interplay between various market indicators.


Let's illustrate Dow Theory with an example using a hypothetical stock market chart. For simplicity, I'll describe how Dow Theory might be applied using various stages of market trends and phases.


Example: Hypothetical Stock XYZ

Primary Trend (Long-Term Trend)


Uptrend: Stock XYZ is in a strong uptrend over several months. The price consistently makes higher highs and higher lows.


Secondary Trend (Intermediate Trend)


Correction: Within the uptrend, XYZ experiences a pullback or consolidation over a few weeks. The price drops but does not break below the previous significant low.


Minor Trend (Short-Term Trend)


Daily Fluctuations: During both the primary uptrend and secondary correction, there are daily price movements, often influenced by market news or short-term factors.


Market Phases


Accumulation: Early in the uptrend, informed investors accumulate shares while the broader market remains skeptical.

Public Participation: As the uptrend gains momentum, more investors notice and start buying.

Distribution: Toward the end of the uptrend, smart investors begin to sell as the public rushes to buy at higher prices.


Averages Must Confirm Each Other


Confirmation: Suppose XYZ is part of an industrial sector, and the transportation index (DJTA) also shows new highs, confirming the strength of the uptrend.


Volume Confirms the Trend


Increasing Volume: During the uptrend, volume increases when prices rise and decreases when prices pull back, confirming the trend's validity.


Trends Persist Until a Reversal Occurs


Reversal Signal: The trend is considered to be intact until a significant reversal signal appears, such as a breach of a major support level or a trendline break.


By observing these elements in the market, traders can use Dow Theory to assess and act on market trends more effectively.

Friday, August 23, 2024

BUY BANKNIFTY (FUTURES) : 51037

 BUY BANKNIFTY (FUTURES) : 51037


BUY BANKNIFTY FUTURES WITHOUT WAITING FOR ANY DIP AND WITH A TARGET AT 51500-51550 STOPLOSS 49900

Thursday, August 22, 2024

FINNIFTY (FUTURES) LTP: 23200.75

 FINNIFTY (FUTURES) LTP: 23200.75


WAIT FOR A DIP IN FINNIFTY FUTURES  TODAY ...   

WILL FACE RESISTANCE AT 23250 AROUND 

TARGETS  ARE 23400-23500 FOR INTRADAY

STOPLOSS 23050


THE TREND LINE BREAKS TODAY OR TOMORROW 


8.54AM


Monday, August 12, 2024

WHAT IS A PENNY STOCK?

 A penny stock is a type of stock that typically trades at a very low price, usually less than $5 per share, and represents small or micro-cap companies. Penny stocks are often traded over-the-counter (OTC) rather than on major stock exchanges like the New York Stock Exchange (NYSE) or Nasdaq, although some may be listed on these exchanges.


### Key Characteristics of Penny Stocks:


1. **Low Price**:

   - Penny stocks usually trade for less than $5 per share, although in some definitions, they may be classified as stocks trading under $1.


2. **Small Market Capitalization**:

   - The companies behind penny stocks often have a small market capitalization (market cap), typically under $300 million, making them micro-cap or nano-cap stocks.


3. **Limited Liquidity**:

   - Penny stocks tend to have lower trading volumes, meaning they are less liquid. This can make it difficult to buy or sell large quantities without affecting the stock price significantly.


4. **Higher Volatility**:

   - Due to their low prices and limited trading volumes, penny stocks can be highly volatile, with prices subject to sharp swings over short periods.


5. **Lack of Information**:

   - Information on penny stocks and the companies behind them is often less readily available, and the companies may not be subject to the same rigorous reporting requirements as larger firms. This can make it challenging for investors to assess the company’s value and prospects.


6. **Risk**:

   - Penny stocks are considered highly speculative and risky investments. The potential for large returns exists, but so does the potential for substantial losses. Many penny stocks are from companies that are new, underperforming, or in financial distress.


### Trading Platforms for Penny Stocks:

- **Over-the-Counter (OTC) Markets**: Many penny stocks are traded on OTC markets such as the OTC Bulletin Board (OTCBB) or the Pink Sheets. These platforms have fewer regulatory requirements than major exchanges.

- **Major Exchanges**: Some penny stocks are listed on major exchanges like the NYSE or Nasdaq, but these are often companies that are in the process of growing and moving out of the penny stock category.


### Why Investors Buy Penny Stocks:

- **Speculative Potential**: Some investors are attracted to penny stocks because of the potential for significant returns. A small investment can lead to substantial profits if the stock price increases.

- **Growth Opportunities**: Investors may believe that the underlying company has strong growth potential, which could lead to a substantial increase in stock price.


### Risks of Penny Stocks:

- **High Volatility**: The prices of penny stocks can fluctuate wildly, leading to significant gains or losses.

- **Lack of Information**: Limited financial and business information can make it difficult to make informed investment decisions.

- **Fraud and Manipulation**: Penny stocks are sometimes targets for fraudulent schemes, such as "pump and dump" operations, where the stock price is artificially inflated and then sold off, leaving other investors with losses.


### Conclusion:

Penny stocks can offer the potential for high returns, but they come with significant risks. They are generally suited for experienced investors who are willing to take on substantial risk and can navigate the challenges of low liquidity, high volatility, and limited information.

WHAT IS STOCK MARKET?


The stock market is a collection of markets and exchanges where the buying, selling, and issuance of shares of publicly held companies occur. It is a crucial component of the global economy, enabling businesses to raise capital by selling ownership stakes to investors, who in return get a chance to share in the company's profits.


### Key Concepts:


1. **Stocks (Shares or Equities)**:

   - A stock represents a share in the ownership of a company. When you own a company's stock, you own a piece of that company and are entitled to a portion of its profits, usually in the form of dividends, and any voting rights attached to the stock.


2. **Stock Exchanges**:

   - Stocks are traded on stock exchanges, which are venues that facilitate the buying and selling of stocks. The most well-known stock exchanges include the New York Stock Exchange (NYSE), Nasdaq, and the London Stock Exchange (LSE).


3. **Stock Indexes**:

   - A stock index is a statistical measure that reflects the performance of a group of stocks. Common examples include the S&P 500, Dow Jones Industrial Average (DJIA), and Nasdaq Composite, which track the performance of large segments of the market.


4. **Market Participants**:

   - Participants in the stock market include individual investors, institutional investors (such as mutual funds, pension funds, and insurance companies), and traders who buy and sell stocks for profit.


5. **Primary and Secondary Markets**:

   - The **primary market** is where new stocks are issued through initial public offerings (IPOs). The **secondary market** is where existing shares are traded among investors.


6. **Bull and Bear Markets**:

   - A **bull market** refers to a period of rising stock prices, often driven by investor optimism. A **bear market** is a period of declining stock prices, usually due to pessimism about economic conditions.


### How the Stock Market Works:

- **Price Determination**: Stock prices are determined by supply and demand. If more investors want to buy a stock than sell it, the price will rise, and if more want to sell than buy, the price will fall.

- **Investing and Trading**: Investors typically buy stocks with the expectation of long-term gains, while traders may buy and sell stocks more frequently to profit from short-term price movements.

- **Regulation**: Stock markets are regulated by government bodies to protect investors and ensure fair trading. In the U.S., for example, the Securities and Exchange Commission (SEC) oversees the markets.


### Importance of the Stock Market:

- **Capital Formation**: The stock market allows companies to raise funds to expand their businesses.

- **Investment Opportunities**: It provides opportunities for investors to build wealth through capital gains and dividends.

- **Economic Indicator**: The stock market is often seen as a barometer of the overall health of the economy, reflecting investor confidence and economic conditions.


Overall, the stock market plays a vital role in the functioning of modern economies, influencing everything from personal wealth to business development and economic growth.

Monday, November 20, 2023

Technical Analysis of Reliance Industries

 Technical Analysis of Reliance Industries Limited (RELIANCE.NS)


Price Action and Volume

Reliance Industries Limited's stock closed marginally lower at 2,355.55 INR in the last trading session, marking a subtle 0.22% decrease from the previous close. Notably, the trading volume of approximately 3.88 million shares was below the average volume of about 6.35 million shares, indicating less trading activity than usual. Despite this low volume, the stock price remained relatively stable within a narrow range between 2,352.05 and 2,373.25 INR on that day.

Technical Indicators

The Relative Strength Index (RSI14) of 69 suggests that Reliance Industries is bordering on overbought territory but is not yet in a zone that typically signals an imminent reversal of the stock's recent uptrend. With the stock price hovering slightly above the 50-day moving average (DMA) of 2,342.06 INR and below the 200 DMA of 2,425.35 INR, investors may see this as a consolidating signal. The Moving Average Convergence Divergence (MACD), currently negative at -4.91, suggests bearish momentum in the medium term. Moreover, the Average True Range (ATR) of 1.25 indicates volatility is within a normal range for the stock.

Support and Resistance

The stock closed just below a minor resistance level at 2,382.15 INR. Should the stock break through this resistance in the next trading day or week, it may encounter fewer obstacles to further price appreciation. Conversely, support is close by at 2,354.95 INR. The stock's stop-loss is calculated at 2,236.82 INR, suggesting a potential floor where investors might mitigate losses should the stock's price begin to decline.

Fundamental Analysis

Market Position and Financial Health

Reliance Industries Limited, with a significant market capitalization of 15.94 trillion INR, stands as one of India's largest and most influential conglomerates. Its diverse portfolio, which spans energy, petrochemicals, textiles, natural resources, retail, and telecommunications, provides a broad revenue base and a critical moat against sector-specific downturns.

Earnings and Valuation Metrics

The company posted an earnings per share (EPS) of 96.02, and the price-to-earnings (PE) ratio of 24.53 indicates that the stock is priced fairly in comparison to its earnings. This PE ratio is within a reasonable range, suggesting that the stock may not be significantly overvalued.

Stock Forecast for Next Trading Day and Upcoming Week

Based on the technical indicators and recent price action, it appears likely that Reliance Industries will continue trading near its support and resistance levels in the next trading day and the upcoming week, barring any major corporate developments or market-moving news. The stock could experience modest gains if it maintains its position above the 50 DMA and breaks through the minor resistance level.

Overall Evaluation and Recommendation

Buy, Hold, or Sell?

Considering Reliance Industries' strong market position, consistent financial performance, and current technical setup, the stock could be categorized as a 'Hold' with a potential upgrade to 'Buy' if the price breaks above resistance. Given the proximity to support levels and the overbought RSI, investors should monitor the stock closely. If the RSI begins to decrease without a corresponding drop in price, this may indicate strengthening for a move higher. Conversely, if the price falls below support levels on higher than average volume, it may signal a move to sell.

However, given the overall stability, strong market cap, and reasonable valuation reflected in the PE ratio, existing investors might hold onto their shares. Prospective investors could consider looking for a more definitive signal from technical indicators or a potential price dip as an entry point, while balancing their decisions with a review of broader market trends and conditions

Sunday, November 12, 2023

BASIC INDICATORS : ADX - AVERAGE DIRECTIONAL INDEX

You can only measure the strength of the trend by using a special trading indicator, ADX (Average Directional Index).

Detecting a strong directional move is the most important skill for all traders to have. No matter what type of trader you are, after you enter a position you need a strong directional move. To make a profit, the move must be in the direction of your trade.

The ADX indicator trading rules can help you achieve your financial goals.

Before moving forward, we need to explain the indicator that this trading strategy is named for.

What is the ADX Indicator?

The principles of the Average Directional Index can apply to almost all tradable assets including stocks, exchange-traded funds, mutual funds, and futures contracts. ADX has become exceptionally useful in futures markets for many reasons:

  • With a standard range of 14 bars, ADX offers a “bigger picture” than many other technical indicators.
  • ADX is time adjusted, meaning that the most recent data is given exceptional weight.
  • ADX helps you identify the strength of a trend, which will be useful for any contract being executed shortly.
  • ADX makes it very easy to compare mutually exclusive futures contracts at once.

Futures traders enjoy using ADX as a metric because it offers the perfect blend of past and present data and future predictability. Successfully purchasing futures contracts will require you to identify which potential contracts are mispriced in the status quo. Using ordinary ADX readings for future contracts makes this possible.

Using ADX readings for major indexes (such as the DJIA, S&P 500, and others) can also help you identify whether the general market is experiencing bearish or bullish conditions.

Moving on…

Let’s see what the best ADX trading rules are and how to use the ADX indicator.

See below:

What are the ADX Indicator Strategy Rules

Before going further into the ADX trading strategy rules, let’s define what the ADX indicator is and how you can profit from it.

The ADX indicator simply measures the strength of a trend and whether we’re in a trading or non-trading period. In other words, the ADX is a trend strength indicator. This method of technical analysis is used to identify the emergence of strong downtrends and buy signals.

Adx Indicator Trading Rules
Adx strategy 1

We need to be very careful about how we read and interpret the ADX indicator. It is not a bullish and bearish indicator. ADX’s moving average only measures the strength of the trend.

So, if the price is going UP, and the ADX indicator is also going UP, then we have the case for a strong bullish case.

The same is true if the price is going DOWN and the ADX indicator is going UP. Then we have the case for a strong bearish case.


Best Adx Strategy
Adx strategy 2

The first ADX indicator trading rule says, a reading below 25 signals a period of non-trading or ranging market. The second ADX indicator trading rule says, when the ADX is above 25 is enough to signal the presence of a strong bullish/bearish trend.

Going forward, keep in mind that the ADX indicator doesn’t give you any information about the direction of the market. It just provides you with information about the strength of a trend.

Let’s move on, and find out how the ADX indicator can be used with different trading styles:

  1. ADX indicator for day trading
  2. ADX indicator for swing trading
  3. First, we’ll focus on how to use ADX indicator for intraday trading.

    See below:

    How to use the ADX indicator for day trading

    The ADX indicator day trading strategy starts with selecting the right settings.

    Let me explain why:

    Short-term charts are fast-paced, so you need to tweak the ADX setting to make it more sensitive to the short-term price changes in the market.

    So…

    The best ADX setting for day trading is the 3-period.

    As a general rule, the shorter the period is, the more sensitive the technical indicator becomes to the price. Therefore, the 3-period ADX indicator works best for day trading.

    As we already know, low ADX readings mean the trend strength is weak while higher ADX readings mean a strong trend. We also know from the natural ebb and flow of the market that prices move from periods of consolidation to trending and vice versa.

    Now, if we combine the two market hypotheses we can conclude the following:

    Low ADX readings (consolidation) should be followed by higher ADX readings (trend).

    So…

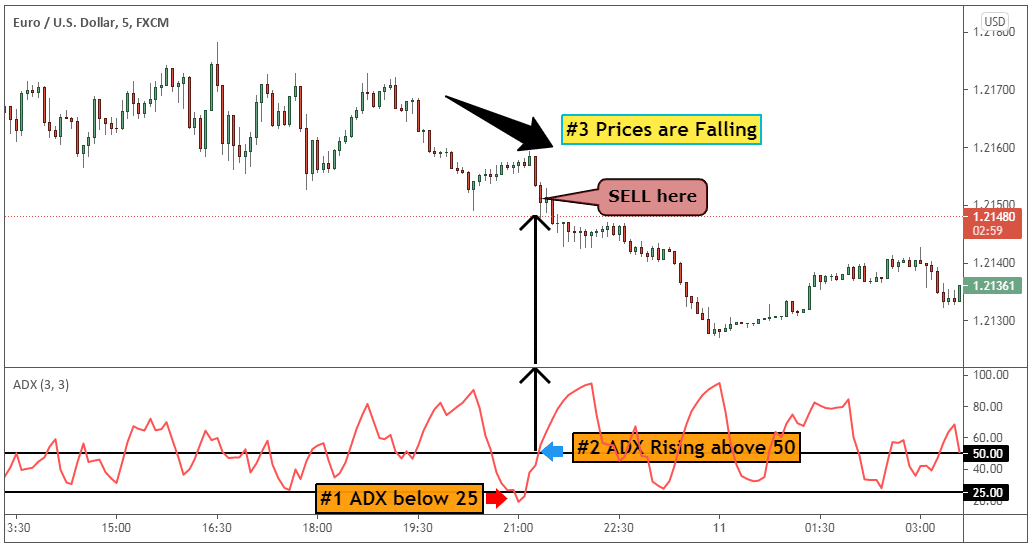
    When day trading with the ADX indicator, we look for clues to buy and sell when ADX falls below 25.

    When the ADX falls below 25 it suggests that there is no strength in the trend and most likely we’re consolidating. This means we can look for potential intraday breakout signals.

    But, since the ADX doesn’t show us the direction of the trend, we wait until the ADX breaks above 50:


    1. If prices are rising with the ADX rising we buy
    2. If the price is falling with the ADX rising we sell

    Nothing speaks louder than a trade example.

    So, here is an example outlining the ADX day trading strategy in action:

    Adx Indicator Intraday
    Adx day trading
  4. Moving on…

    Let’s see how the ADX indicator for swing trading works.

    See below:

    How to use the ADX indicator Strategy for Swing Trading

    Swing trading with the ADX indicator is a lot easier because after all the trend strength indicator works better for position trading.

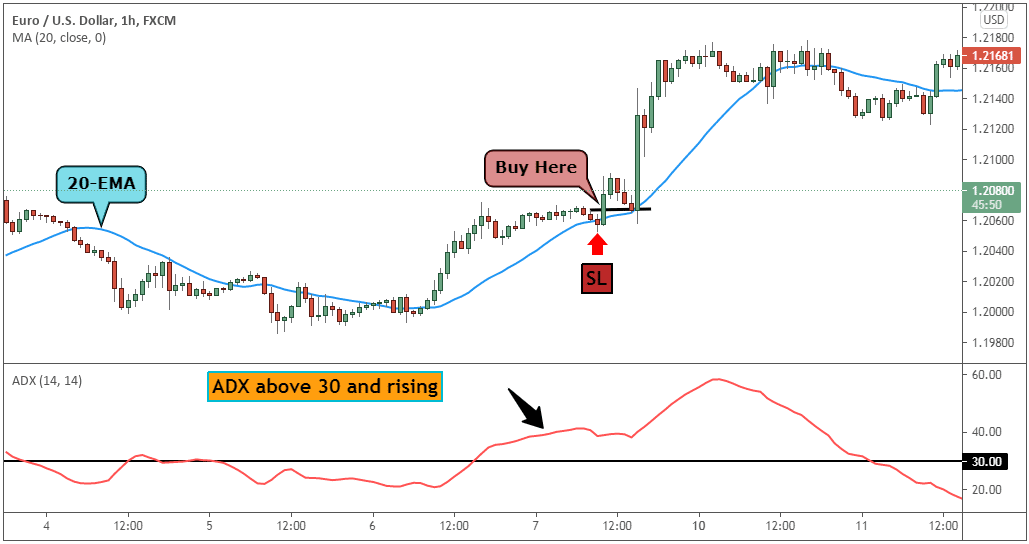
    Here, we like the Holy Grail strategy, which is based on the ADX indicator and the 20-period EMA.

    This strategy is from the book “Street Smart” by Larry Connors and Linda Raschke.

    If you want to use this ADX swing trading strategy, you need to follow these simple rules:

    1. ADX must cross above 30 – this will signal a strong trending market
    2. Wait for the price to retrace to the 20-EMA
    3. When the price touches 20-EMA, place a buy above the high of the previous bar
    4. Place SL below the newly formed swing low
    5. Here is an example:

    6. Adx Strategy Pdf
      Adx swing trading

      Next…

      Let’s see what are the most common ADX period settings.

      See below:

      What are the best ADX Indicator Settings?

      The ADX indicator uses a smoothing moving average in its calculation. We find out that the best ADX indicator settings to use is 14 periods. With our ADX indicator settings, you’ll have more accurate signals and it will help you get in a trade earlier.

      Adx Indicator Settings
      Adx strategy 3

      The ADX indicator works best when used in combination with other technical indicators.

      The best ADX strategy also incorporates the RSI indicator in order to time the market. The ADX indicator can only help us to gauge the intensity of the trend. So, we need the RSI indicator for entry signals.

      The RSI uses a 20-period setting, which is the same as the ADX indicator settings.

      Finally, your chart setup should have at the bottom both the ADX and RSI indicator. It should be the same as in the figure below.

      How To Use Adx Indicator
      Adx strategy 4

      Now, let’s see how you can effectively trade with the best ADX strategy. You will learn how to make profits by applying the ADX indicator trading rules.

      See below:

      The Best ADX Trading Strategy

      The ADX indicator strategy rules will ensure that you only trade when there is a strong trend on the 5-minute chart or the daily chart. In this regard, the best ADX strategy is a universal strategy that performs the same, regardless of the time frame used.

      Moving forward, we’re going to look for selling opportunities.

      Step #1: Wait for the ADX indicator to show a reading above 25.

      Before we even look to see if the market goes up or down, we must first wait for the ADX indicator to show a reading above 25. Based on the ADX indicator trading rules, a reading above 25 signals a strong trend and the likelihood of a trend developing.

      Adx Indicator Intraday
      Adx strategy 5

      We all know that the trend is our friend, but without real strength behind the trend, the newly formed trend can quickly fade away.

      In order to gauge the direction of the trend, we also need to look at the actual price action. This brings us to the next step of the best ADX strategy.

      Step #2: Use the last 50 candlesticks to determine the trend. For sell signals, look for prices to develop a bearish trend.

      No matter what your time frame is, we need a practical way to determine the direction of the trend.

      By using a sample size of 50 candlesticks to determine the trend we ensure that we trade in the moment of now. We like to keep things simple, so if the price is heading lower during the last 50 candlesticks we’re in a bearish trend.

      How To Read Adx
      Adx strategy 6

      Now, it’s time to focus on the catalyst that will trigger our sell signal for the best ADX strategy.

      Step #3: Sell when the RSI indicator breaks and show a reading below 30.

      For our entry signal, we’ll be using the RSI indicator that uses the same settings as the ADX indicator settings. Normally the RSI reading below 30 shows an oversold market and a reversal zone. However, smart trading means looking beyond what the textbook is saying.

      In a strong trend as it’s defined by the ADX indicator that’s precisely what we want to see. We want more sellers coming into the market.

      So, we want to sell when the RSI indicator breaks and shows a reading below 30.

      Adx Indicator Mt4
      Adx strategy 7

      The next important thing we need to establish is where to place your protective stop loss.

      See below…

      Step #4: Protective Stop Loss should be placed at the last ADX high.

      In order to determine the stop-loss location for the best ADX strategy, first identify the point where the ADX made the last high prior to our entry. Secondly, find the corresponding high on the price chart from the ADX high and there you have it your SL level.

      Adx Setting For 5 Minute Chart
      Adx strategy 8

      Last but not least the best ADX strategy also needs a place where we need to take profits, which brings us to the last step of this unique strategy.

      Step #5: Take Profit when the ADX indicator breaks back below 25.

      The best ADX strategy seeks to only capture those profits that emerged from the presence of a strong trend. Once the prospects of a strong trend fade away we look to take profits and wait for another trading opportunity.

      To accomplish this we take profits as soon as the ADX indicator breaks back below 25.

      An ADX reading back below 25 suggests the prevailing trend is running out of strength.

      Adx Indicator Intraday
      Adx strategy 9

      Note** The above was an example of a SELL trade using the ADX indicator trading rules. Use the same rules but in reverse, for a BUY trade. In the figure below you can see an actual BUY trade example.  

      Take a look:

      Adx Indicator Trading Rules
      Adx strategy 10

      ADX Trading Strategy Frequently Asked Questions

      What is ADX?

      ADX (Average Directional Index) is a technical analysis indicator used to measure the strength of a trend in the market. It ranges from 0-100, with a reading above 25 indicating a strong trend, and a reading below 25 indicating a weak trend.

      How is ADX calculated?

      ADX is calculated by taking the difference between the DI+ and DI- indicators, dividing it by their sum, and multiplying the result by 100. The result is an index ranging from 0-100.

      How do I use ADX for day trading?

      ADX can be used for day trading by identifying strong trends in the market and entering trades in the direction of the trend. Traders can also use ADX to set stop-loss levels and identify potential trend reversals.

      What are the best ADX settings for a 5-minute chart?

      The best ADX settings for a 5-minute chart depend on the trader’s preferences and trading style. However, some commonly used settings are 7 for the period, and 20 for the threshold level.

      What are the best ADX settings for a 1-minute chart?

      The best ADX settings for a 1-minute chart depend on the trader’s preferences and trading style. However, some commonly used settings are 3 for the period, and 10 for the threshold level.

      What are the best ADX settings for a 15-minute chart?

      The best ADX settings for a 15-minute chart depend on the trader’s preferences and trading style. However, some commonly used settings are 14 for the period, and 25 for the threshold level.

      Conclusion – ADX Indicator

      The best ADX strategy gives us very useful information because a lot of the time, we as traders don’t want to get into something that’s moving nowhere and not trending in a strong fashion.

      By applying the ADX indicator trading rules one can take advantage of the strength of the trend and cash in quick profits. The bottom line is that the best profits come from catching strong trends and the best ADX strategy can help you accomplish your trading goals.

      The best ADX strategy is similar to the Best Momentum Trading Strategy for Quick Profits because both strategies seek to take advantage of the strength of the trend.

      Thank you for reading!

CASE STUDY : ADANI PORTS OPTION CHAIN USING LTP CALCULATOR METHOD ON 01.10.2024

  ON 01.10.2024   GOOD BREAKOUT AFTER CONSOLIDATION SEEN IN ADANIPORTS  HERE ARE SOME IMPORTANT POINTS ABOUT THE BREAKOUT 1. BEFORE BREAKOUT...

Popular Posts