You can only measure the strength of the trend by using a special trading indicator, ADX (Average Directional Index).
Detecting a strong directional move is the most important skill for all traders to have. No matter what type of trader you are, after you enter a position you need a strong directional move. To make a profit, the move must be in the direction of your trade.
The ADX indicator trading rules can help you achieve your financial goals.
Before moving forward, we need to explain the indicator that this trading strategy is named for.
What is the ADX Indicator?
The principles of the Average Directional Index can apply to almost all tradable assets including stocks, exchange-traded funds, mutual funds, and futures contracts. ADX has become exceptionally useful in futures markets for many reasons:
- With a standard range of 14 bars, ADX offers a “bigger picture” than many other technical indicators.
- ADX is time adjusted, meaning that the most recent data is given exceptional weight.
- ADX helps you identify the strength of a trend, which will be useful for any contract being executed shortly.
- ADX makes it very easy to compare mutually exclusive futures contracts at once.
Futures traders enjoy using ADX as a metric because it offers the perfect blend of past and present data and future predictability. Successfully purchasing futures contracts will require you to identify which potential contracts are mispriced in the status quo. Using ordinary ADX readings for future contracts makes this possible.
Using ADX readings for major indexes (such as the DJIA, S&P 500, and others) can also help you identify whether the general market is experiencing bearish or bullish conditions.
Moving on…
Let’s see what the best ADX trading rules are and how to use the ADX indicator.
See below:
What are the ADX Indicator Strategy Rules
Before going further into the ADX trading strategy rules, let’s define what the ADX indicator is and how you can profit from it.
The ADX indicator simply measures the strength of a trend and whether we’re in a trading or non-trading period. In other words, the ADX is a trend strength indicator. This method of technical analysis is used to identify the emergence of strong downtrends and buy signals.

We need to be very careful about how we read and interpret the ADX indicator. It is not a bullish and bearish indicator. ADX’s moving average only measures the strength of the trend.
So, if the price is going UP, and the ADX indicator is also going UP, then we have the case for a strong bullish case.
The same is true if the price is going DOWN and the ADX indicator is going UP. Then we have the case for a strong bearish case.

The first ADX indicator trading rule says, a reading below 25 signals a period of non-trading or ranging market. The second ADX indicator trading rule says, when the ADX is above 25 is enough to signal the presence of a strong bullish/bearish trend.
Going forward, keep in mind that the ADX indicator doesn’t give you any information about the direction of the market. It just provides you with information about the strength of a trend.
Let’s move on, and find out how the ADX indicator can be used with different trading styles:
- ADX indicator for day trading
- ADX indicator for swing trading
First, we’ll focus on how to use ADX indicator for intraday trading.
See below:
How to use the ADX indicator for day trading
The ADX indicator day trading strategy starts with selecting the right settings.
Let me explain why:
Short-term charts are fast-paced, so you need to tweak the ADX setting to make it more sensitive to the short-term price changes in the market.
So…
The best ADX setting for day trading is the 3-period.
As a general rule, the shorter the period is, the more sensitive the technical indicator becomes to the price. Therefore, the 3-period ADX indicator works best for day trading.
As we already know, low ADX readings mean the trend strength is weak while higher ADX readings mean a strong trend. We also know from the natural ebb and flow of the market that prices move from periods of consolidation to trending and vice versa.
Now, if we combine the two market hypotheses we can conclude the following:
Low ADX readings (consolidation) should be followed by higher ADX readings (trend).
So…
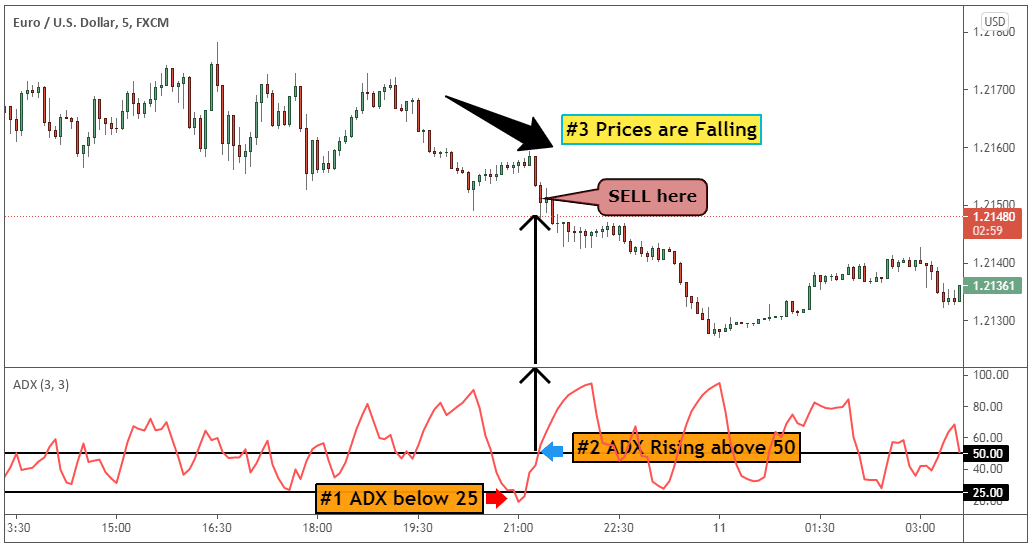
When day trading with the ADX indicator, we look for clues to buy and sell when ADX falls below 25.
When the ADX falls below 25 it suggests that there is no strength in the trend and most likely we’re consolidating. This means we can look for potential intraday breakout signals.
But, since the ADX doesn’t show us the direction of the trend, we wait until the ADX breaks above 50:
- If prices are rising with the ADX rising we buy
- If the price is falling with the ADX rising we sell
Nothing speaks louder than a trade example.
So, here is an example outlining the ADX day trading strategy in action:
Adx day trading Moving on…
Let’s see how the ADX indicator for swing trading works.
See below:
How to use the ADX indicator Strategy for Swing Trading
Swing trading with the ADX indicator is a lot easier because after all the trend strength indicator works better for position trading.
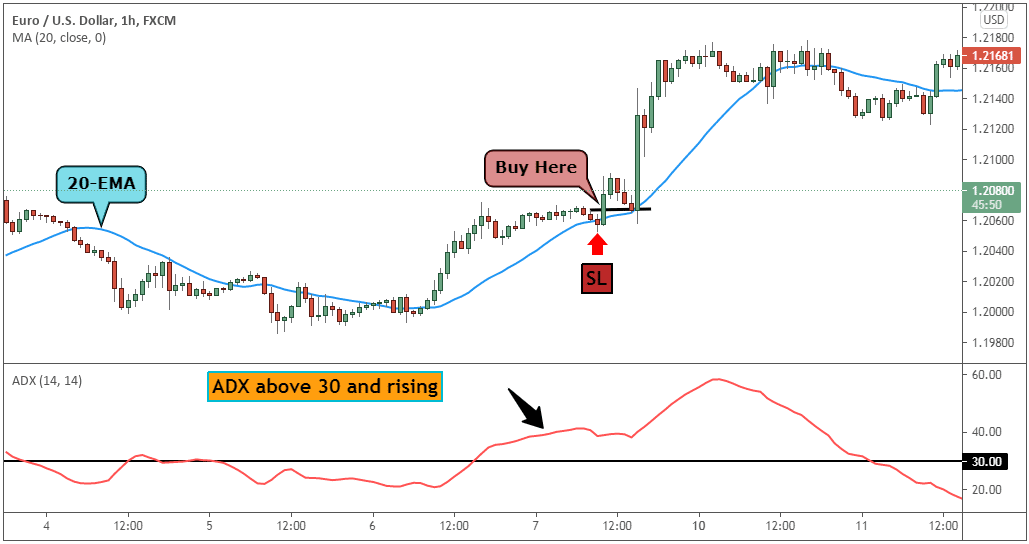
Here, we like the Holy Grail strategy, which is based on the ADX indicator and the 20-period EMA.
This strategy is from the book “Street Smart” by Larry Connors and Linda Raschke.
If you want to use this ADX swing trading strategy, you need to follow these simple rules:
- ADX must cross above 30 – this will signal a strong trending market
- Wait for the price to retrace to the 20-EMA
- When the price touches 20-EMA, place a buy above the high of the previous bar
- Place SL below the newly formed swing low
Here is an example:
Adx swing trading Next…
Let’s see what are the most common ADX period settings.
See below:
What are the best ADX Indicator Settings?
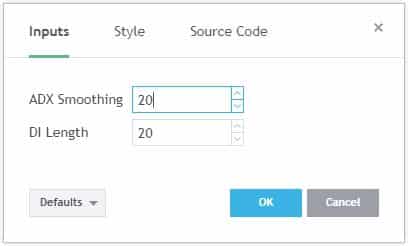
The ADX indicator uses a smoothing moving average in its calculation. We find out that the best ADX indicator settings to use is 14 periods. With our ADX indicator settings, you’ll have more accurate signals and it will help you get in a trade earlier.
Adx strategy 3 The ADX indicator works best when used in combination with other technical indicators.
The best ADX strategy also incorporates the RSI indicator in order to time the market. The ADX indicator can only help us to gauge the intensity of the trend. So, we need the RSI indicator for entry signals.
The RSI uses a 20-period setting, which is the same as the ADX indicator settings.
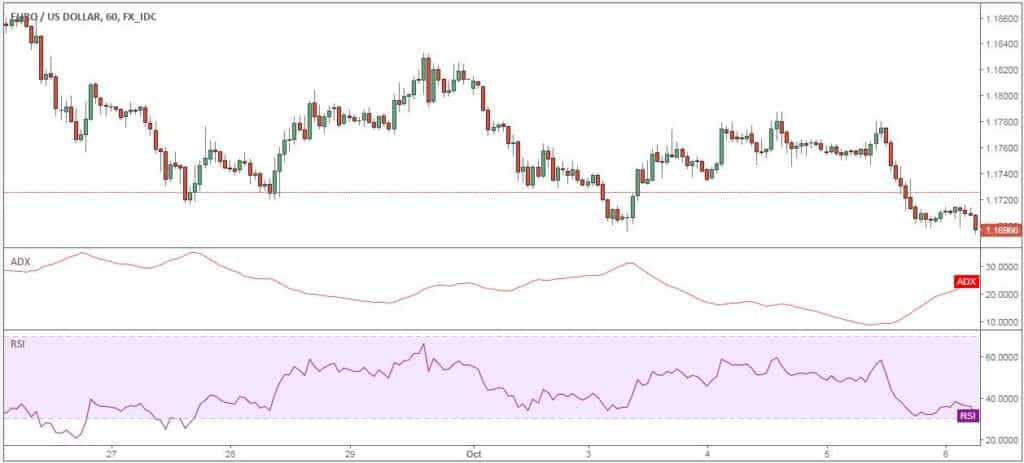
Finally, your chart setup should have at the bottom both the ADX and RSI indicator. It should be the same as in the figure below.
Adx strategy 4 Now, let’s see how you can effectively trade with the best ADX strategy. You will learn how to make profits by applying the ADX indicator trading rules.
See below:
The Best ADX Trading Strategy
The ADX indicator strategy rules will ensure that you only trade when there is a strong trend on the 5-minute chart or the daily chart. In this regard, the best ADX strategy is a universal strategy that performs the same, regardless of the time frame used.
Moving forward, we’re going to look for selling opportunities.
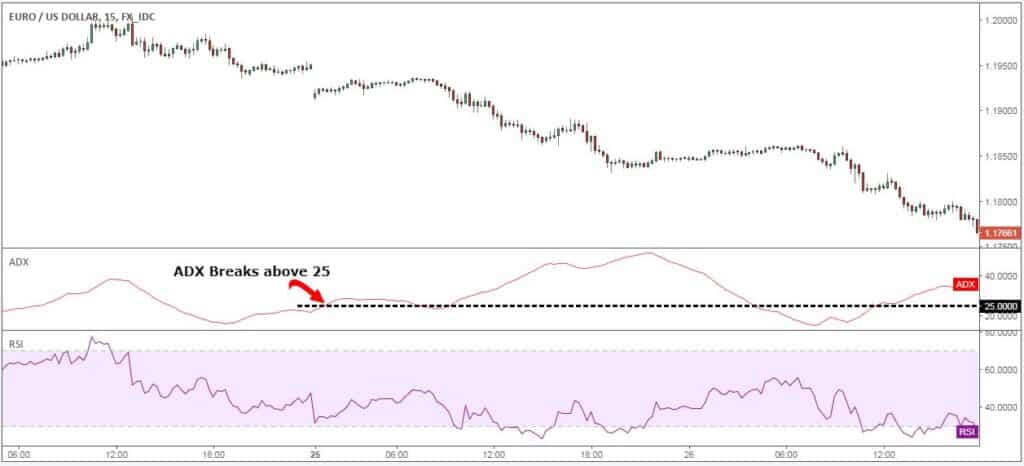
Step #1: Wait for the ADX indicator to show a reading above 25.
Before we even look to see if the market goes up or down, we must first wait for the ADX indicator to show a reading above 25. Based on the ADX indicator trading rules, a reading above 25 signals a strong trend and the likelihood of a trend developing.
Adx strategy 5 We all know that the trend is our friend, but without real strength behind the trend, the newly formed trend can quickly fade away.
In order to gauge the direction of the trend, we also need to look at the actual price action. This brings us to the next step of the best ADX strategy.
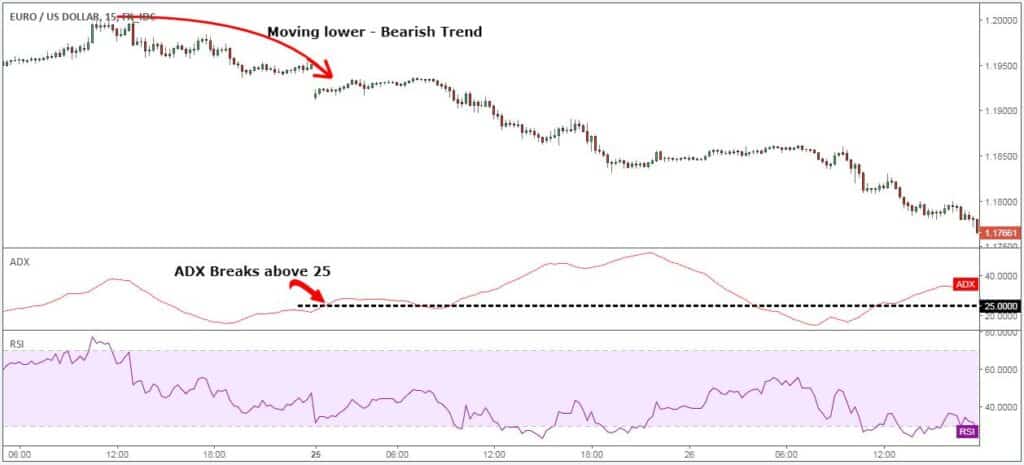
Step #2: Use the last 50 candlesticks to determine the trend. For sell signals, look for prices to develop a bearish trend.
No matter what your time frame is, we need a practical way to determine the direction of the trend.
By using a sample size of 50 candlesticks to determine the trend we ensure that we trade in the moment of now. We like to keep things simple, so if the price is heading lower during the last 50 candlesticks we’re in a bearish trend.
Adx strategy 6 Now, it’s time to focus on the catalyst that will trigger our sell signal for the best ADX strategy.
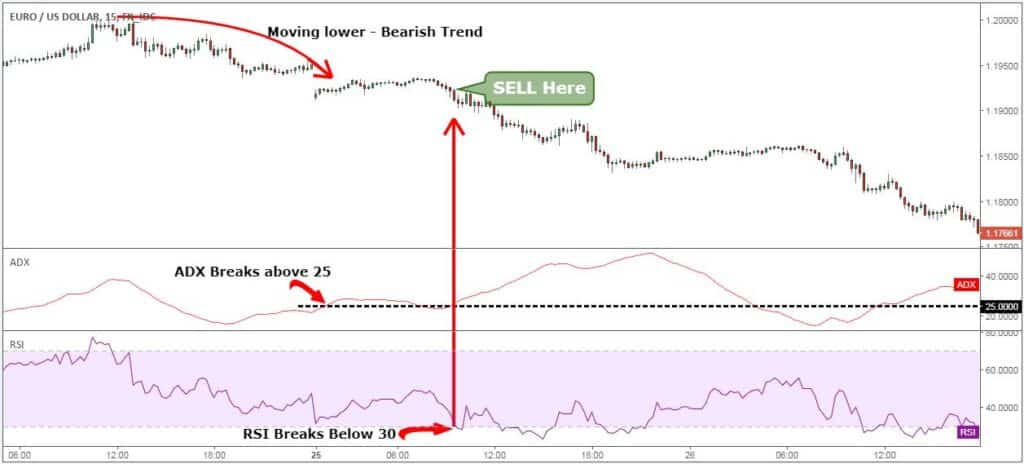
Step #3: Sell when the RSI indicator breaks and show a reading below 30.
For our entry signal, we’ll be using the RSI indicator that uses the same settings as the ADX indicator settings. Normally the RSI reading below 30 shows an oversold market and a reversal zone. However, smart trading means looking beyond what the textbook is saying.
In a strong trend as it’s defined by the ADX indicator that’s precisely what we want to see. We want more sellers coming into the market.
So, we want to sell when the RSI indicator breaks and shows a reading below 30.
Adx strategy 7 The next important thing we need to establish is where to place your protective stop loss.
See below…
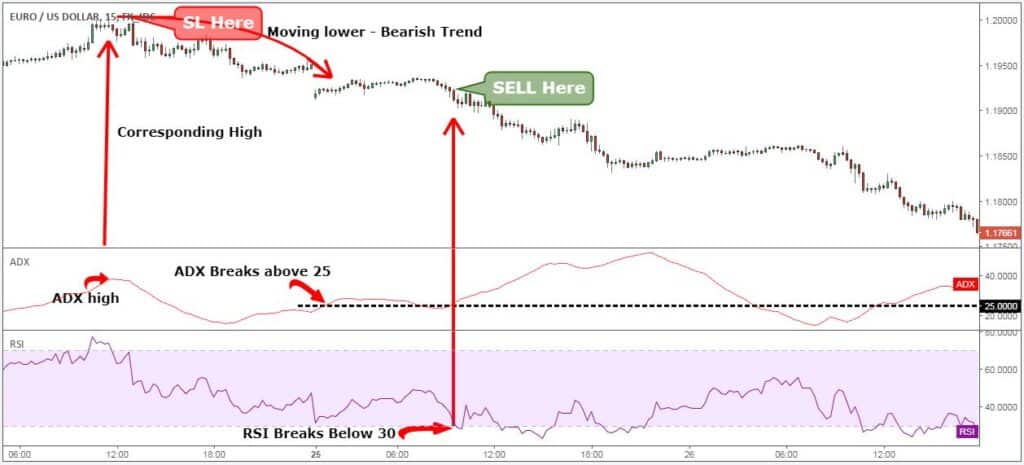
Step #4: Protective Stop Loss should be placed at the last ADX high.
In order to determine the stop-loss location for the best ADX strategy, first identify the point where the ADX made the last high prior to our entry. Secondly, find the corresponding high on the price chart from the ADX high and there you have it your SL level.
Adx strategy 8 Last but not least the best ADX strategy also needs a place where we need to take profits, which brings us to the last step of this unique strategy.
Step #5: Take Profit when the ADX indicator breaks back below 25.
The best ADX strategy seeks to only capture those profits that emerged from the presence of a strong trend. Once the prospects of a strong trend fade away we look to take profits and wait for another trading opportunity.
To accomplish this we take profits as soon as the ADX indicator breaks back below 25.
An ADX reading back below 25 suggests the prevailing trend is running out of strength.
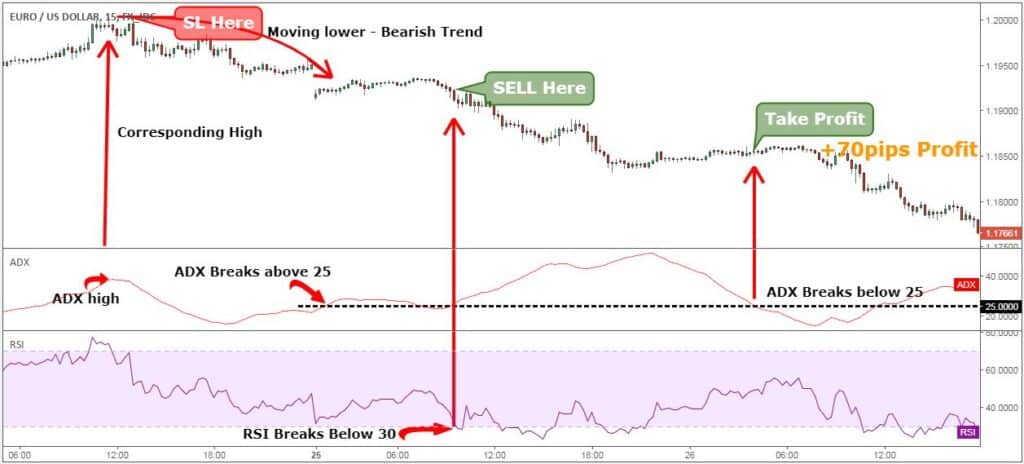
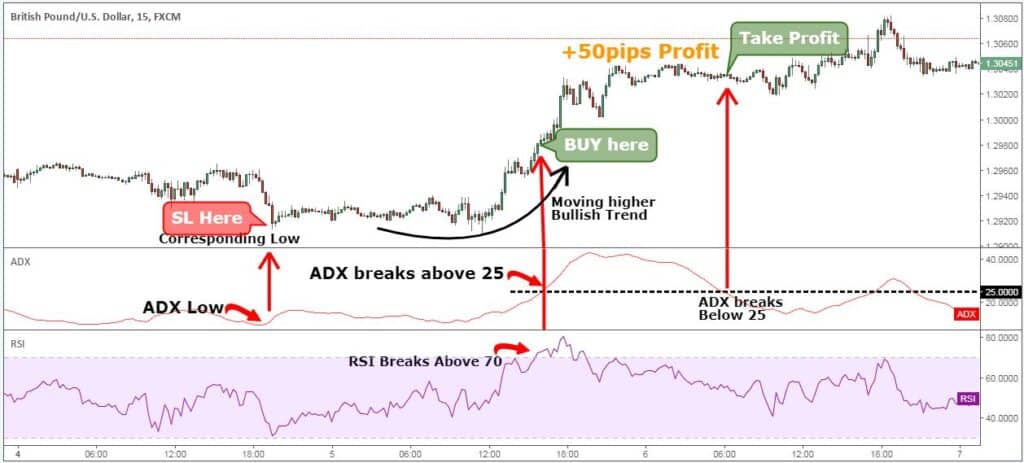
Adx strategy 9 Note** The above was an example of a SELL trade using the ADX indicator trading rules. Use the same rules but in reverse, for a BUY trade. In the figure below you can see an actual BUY trade example.
Take a look:
Adx strategy 10 ADX Trading Strategy Frequently Asked Questions
What is ADX?
ADX (Average Directional Index) is a technical analysis indicator used to measure the strength of a trend in the market. It ranges from 0-100, with a reading above 25 indicating a strong trend, and a reading below 25 indicating a weak trend.
How is ADX calculated?
ADX is calculated by taking the difference between the DI+ and DI- indicators, dividing it by their sum, and multiplying the result by 100. The result is an index ranging from 0-100.
How do I use ADX for day trading?
ADX can be used for day trading by identifying strong trends in the market and entering trades in the direction of the trend. Traders can also use ADX to set stop-loss levels and identify potential trend reversals.
What are the best ADX settings for a 5-minute chart?
The best ADX settings for a 5-minute chart depend on the trader’s preferences and trading style. However, some commonly used settings are 7 for the period, and 20 for the threshold level.
What are the best ADX settings for a 1-minute chart?
The best ADX settings for a 1-minute chart depend on the trader’s preferences and trading style. However, some commonly used settings are 3 for the period, and 10 for the threshold level.
What are the best ADX settings for a 15-minute chart?
The best ADX settings for a 15-minute chart depend on the trader’s preferences and trading style. However, some commonly used settings are 14 for the period, and 25 for the threshold level.
Conclusion – ADX Indicator
The best ADX strategy gives us very useful information because a lot of the time, we as traders don’t want to get into something that’s moving nowhere and not trending in a strong fashion.
By applying the ADX indicator trading rules one can take advantage of the strength of the trend and cash in quick profits. The bottom line is that the best profits come from catching strong trends and the best ADX strategy can help you accomplish your trading goals.
The best ADX strategy is similar to the Best Momentum Trading Strategy for Quick Profits because both strategies seek to take advantage of the strength of the trend.
Thank you for reading!